私たちの生活に欠かせない「雨」は、単なる気象現象ではなく、地球上の水循環を支える極めて重要なプロセスです。空から降り注ぐ水滴がどのように形成され、なぜ地域によって降水量に劇的な差が生まれるのか。その科学的な仕組みから、世界各地の極端な降水記録までを詳しく解説します。
雨の始まりは、大気中の水蒸気が飽和状態になり、凝結して雲ができることから始まります。雲の中では微小な水滴が衝突して合体(併合)したり、氷晶が成長したりすることで、重力に抗えない大きさまで成長し、地上へと落下します。
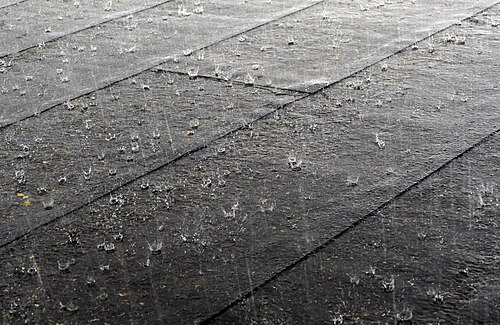
Key Facts
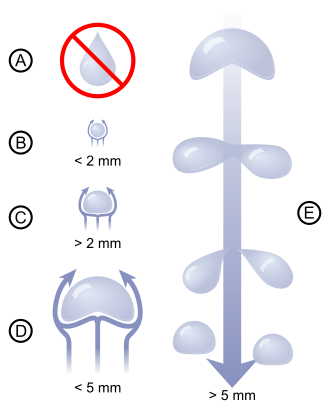
- 雨粒の形状: 一般的なイメージの「涙型」ではなく、実際にはサイズによって球形から底が平らな形へと変化します。
- 降水の要因: 前線の活動、強い上昇気流による対流、山脈による強制上昇(地形的要因)などが主な原因です。
- 強度の定義: 1時間あたり2.5mm未満を「弱」、50mmを超えるものを「激しい(猛烈な)」雨と分類します。
- 世界的な極端値: インドのマウシンラムやチェラプンジは、世界的に見ても極めて高い年間・月間降水量を記録する地域です。
雨粒の科学:形状と挙動
多くの人が雨粒を涙のような形だと考えていますが、これは誤解です。実際には、非常に小さな雨粒はほぼ完全な球形をしています。しかし、雨粒が大きくなるにつれて、落下時の空気抵抗によって底面が押しつぶされ、平らな形状へと変化します。さらに巨大化した雨粒は、空気抵抗に耐えきれず不安定になり、最終的に小さな水滴へと分裂します。
また、雨が地上に届く前に蒸発してしまう現象を降水帯(Virga)と呼びます。これは特に乾燥した地域で見られる現象で、雲から雨は出ているものの、地面に到達する前に消えてしまう状態を指します。

雨が降る主な原因とメカニズム
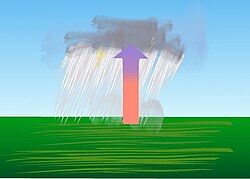
降水が発生するメカニズムは主に3つのパターンに分けられます。一つは、性質の異なる空気の塊がぶつかり合う「前線活動」によるものです。もう一つは、地表の加熱によって強い上昇気流が発生する対流性降水で、激しい雷雨などを引き起こします。
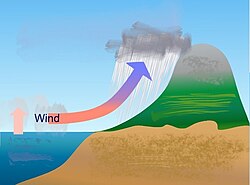
三つ目は、湿った空気が山脈などの地形にぶつかって強制的に上昇させられる地形性降水です。これにより、山の風上側では大量の雨が降り、風下側では乾燥した空気が降りてくるため、降水量に大きな差が生じます。
熱帯地方では、これらのメカニズムに加えて、季節風(モンソン)の影響を強く受けます。これにより、明確な「雨季」と「乾季」を持つ地域が多く存在します。
気候変動と環境への影響
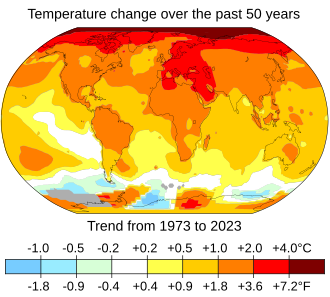
近年の地球温暖化に伴い、地表温度の上昇が観測されています。気温が上がると大気が保持できる水蒸気量が増えるため、一度に降る雨の量が増加し、極端な豪雨の頻度が高まる傾向にあります。
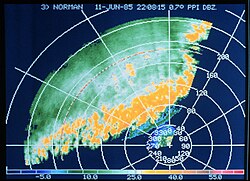
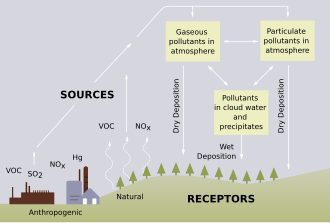
また、気象レーダーなどの観測技術により、激しい雷雨の帯(スクオールライン)などの構造が可視化できるようになりました。一方で、大気汚染物質が雨に溶け込むことで発生する酸性雨は、森林や建築物に悪影響を及ぼす環境問題となっています。
世界的な降水分布は、ケッペンの気候区分などの指標で分類されており、熱帯雨林から極地砂漠まで、緯度や地形によって多様なパターンを描いています。
![Köppen–Geiger map using 1991-2020 data with the -3C winter threshold[93] Af Am Aw BWh BWk BSh BSk Csa Csb Cwa Cwb Cfa Cfb Cfc Dsa Dsb Dsc Dsd Dwa Dwb Dwc Dwd Dfa Dfb Dfc Dfd ET EF](/images/07/d8/07d8ef448286019bc02142e7a3123fa2ca97f1782774b9920bad32794bded018.png)
雨の測定と予測
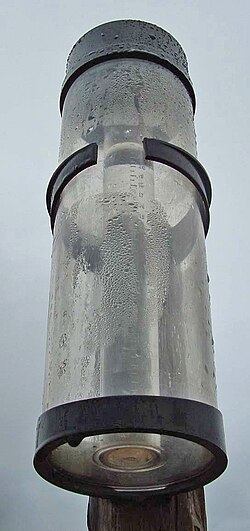
降水量は、標準的な雨量計を用いて地上で直接測定されるほか、気象レーダーや衛星によるリモートセンシング技術を用いて推定されます。これにより、広範囲の降水分布をリアルタイムで把握することが可能です。
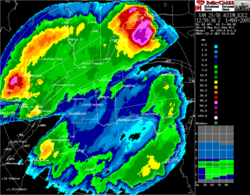
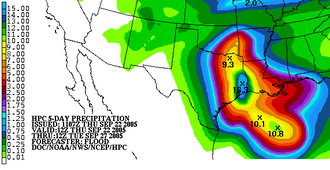
レーダーによる観測では、山岳地帯などで電波が遮られる「遮蔽(ビームブロッキング)」が発生することがあり、データの補完が必要な場合があります。また、現代の気象予測では、5日先までの降水量予測などが詳細に行われています。
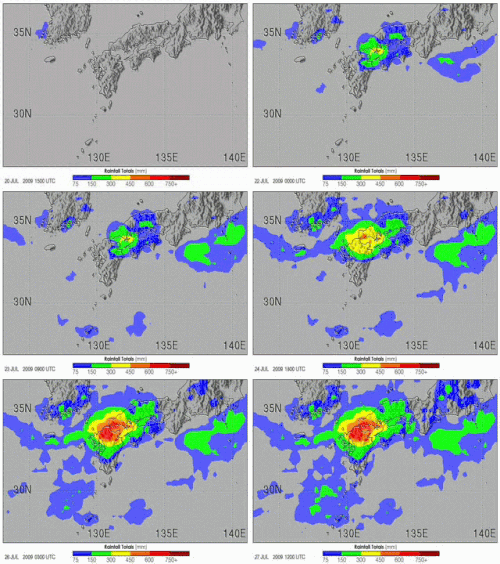
これらの予測データは、農業計画や防災対策に不可欠であり、特に日本のような台風の影響を受けやすい地域では、詳細な降水推定が重要視されています。
文化的側面と地球規模の分布
雨は生存に不可欠な資源であるため、古くから多くの文化や宗教において特別な意味を持ってきました。干ばつ時に雨を願う「雨乞いの舞」などの儀式は、世界各地で見られます。

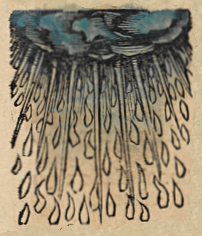
一方で、地球上にはほとんど雨が降らない砂漠地帯も存在します。極地砂漠や熱帯砂漠では、降水量が極めて少なく、稀にしか雨が降りません。そのような環境でも、時折垂直に高く発達した雲から局地的な雨が降ることがあります。
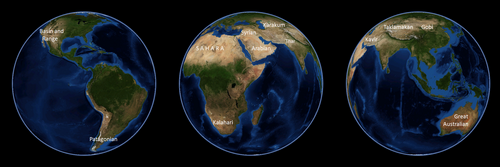
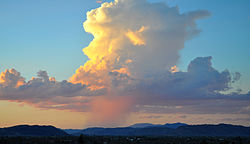
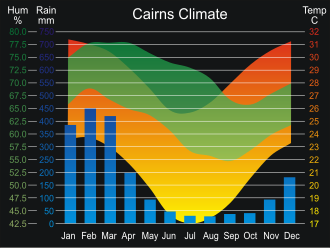
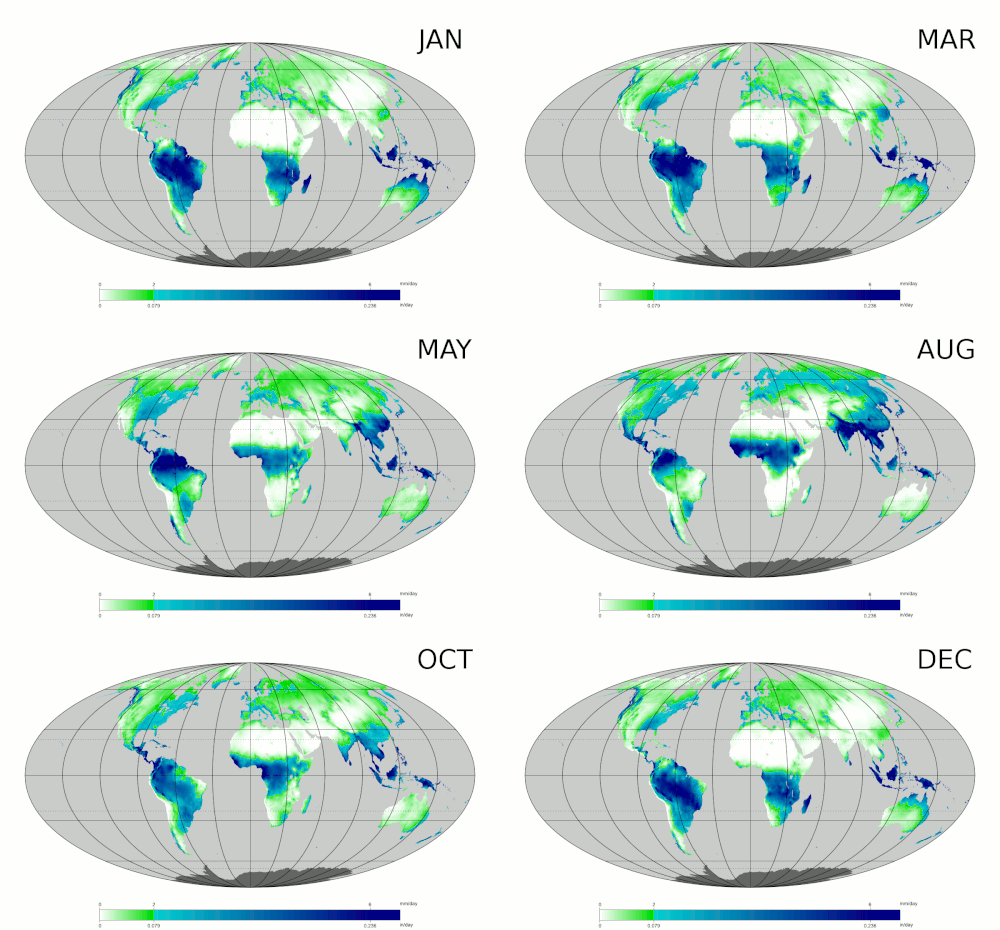
月ごとの平均降水量を分析すると、地域ごとの季節性が明確になります。熱帯地域では年間を通じて多い場所がある一方、温帯地域では季節による変動が顕著です。
極端な例として、24時間で280mmという猛烈な雨が記録される地域もあり、こうした集中豪雨は深刻な洪水被害をもたらします。
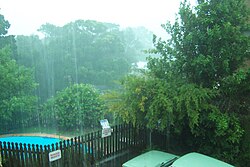
世界的な降水記録まとめ
以下に、世界各地の極端な降水記録をまとめます。
| 区分 | 場所 | 記録内容 | 数値 |
|---|---|---|---|
| 最高平均年降水量(推定) | コロンビア・リョロ | 年平均 | 13,299 mm |
| 最高年降水量 | インド・チェラプンジ | 1年間 | 26,470 mm |
| 最高月間降水量 | インド・チェラプンジ | 1ヶ月間 | 9,296 mm |
| 最高24時間降水量 | レユニオン島・フォックフォック | 24時間 | 1,820 mm |
| 最高1分間降水量 | 米国・ユニオンビル | 1分間 | 31.2 mm |
Frequently Asked Questions
雨粒は本当に涙の形ではないのですか?
はい、実際には涙型ではありません。小さな雨粒は球形に近く、大きくなると空気抵抗で底が平らになります。さらに大きくなると、空気の圧力で崩れて分裂します。
「激しい雨」の基準は何ですか?
一般的に、1時間あたりの降水量が50mmを超えるものが「激しい(または猛烈な)」雨と定義されます。一方で、2.5mm未満は「弱い」雨に分類されます。
地形性降水とはどのような仕組みですか?
湿った空気が山などの高い地形にぶつかり、強制的に上昇させられることで冷却され、水蒸気が凝結して雨になる現象です。山の風上側で多く発生します。
世界で最も雨が多い場所はどこですか?
インドのマウシンラムやチェラプンジが世界的に有名です。特にチェラプンジでは、年間の最高降水量や月間の最高降水量の世界記録が報告されています。
雨が降っているのに地面に届かない現象はありますか?
あります。これを「Virga(降水帯/降水蒸発)」と呼びます。雲から雨は降り出していますが、地表に達する前に乾燥した空気によって蒸発してしまう現象です。
References
- "The Water Cycle". Planetguide.net. Archived from the original on 26 December 2011. Retrieved 26 December 2011.
- Steve Kempler (2009). "Parameter information page". . Archived from the original on 26 November 2007. Retrieved 27 December 2008.
- Mark Stoelinga (12 September 2005). Atmospheric Thermodynamics (PDF). . p. 80. Archived from the original (PDF) on 2 June 2010. Retrieved 30 January 2010.
- Glossary of Meteorology (June 2000). "Relative Humidity". . Archived from the original on 7 July 2011. Retrieved 29 January 2010.
- Glossary of Meteorology (June 2000). "Cloud". . Archived from the original on 20 December 2008. Retrieved 29 January 2010.
- Naval Meteorology and Oceanography Command (2007). "Atmospheric Moisture". United States Navy. Archived from the original on 14 January 2009. Retrieved 27 December 2008.
- Glossary of Meteorology (2009). "Adiabatic Process". . Archived from the original on 17 October 2007. Retrieved 27 December 2008.
- TE Technology, Inc (2009). "Peltier Cold Plate". Archived from the original on 1 January 2009. Retrieved 27 December 2008.
- Glossary of Meteorology (2009). "Radiational cooling". . Archived from the original on 12 May 2011. Retrieved 27 December 2008.
- Robert Fovell (2004). "Approaches to saturation" (PDF). . Archived from the original (PDF) on 25 February 2009. Retrieved 7 February 2009.
📸 フォトギャラリー