タグ

分岐図

1 件の記事

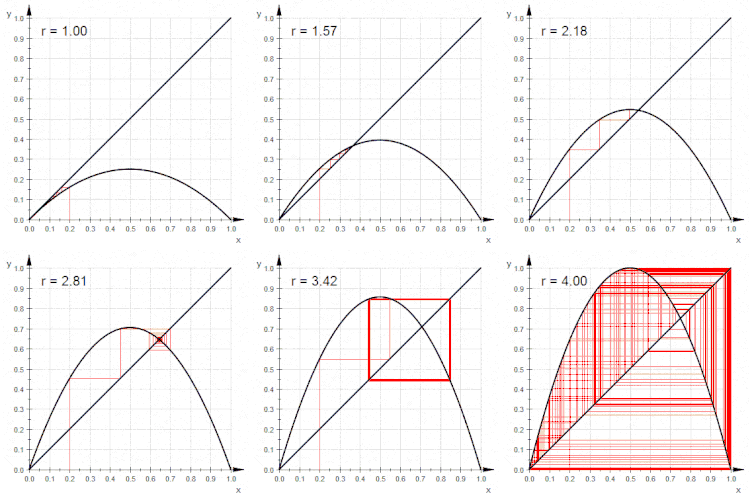
The behavior of the logistic map is shown in Cobweb plot form. The animation shows the change in behavior as the parameter (r in the figure) is increased from 1 to 4, starting from an initial function value of 0.2.

ロジスティック写像単純な数式が導くカオスと秩序の世界

ロジスティック写像カオス理論分岐図周期倍分化